What is a Funnel Chart in Marketing?
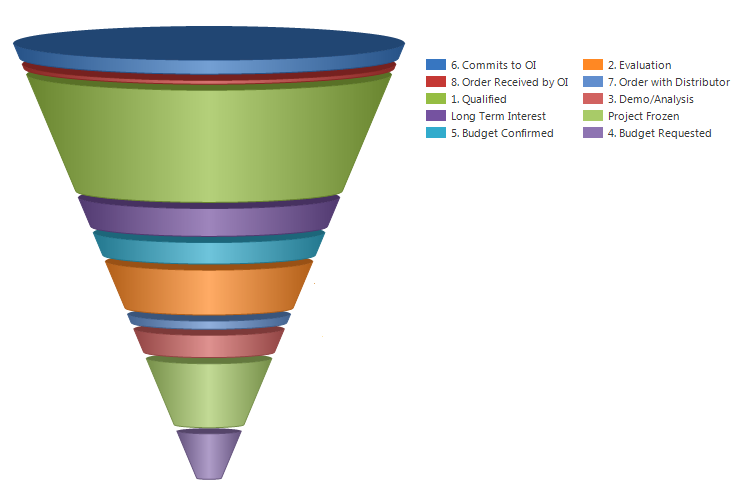
In Microsoft Excel, a funnel chart is a graphic representation of data generally shown as a pyramid. It usually refers to the number of site visits, prospects, or buyers going through a sales funnel. Typically, it displays the succession stages of rectangle-shaped bars, with the width of each bar corresponding to its value. Each subsequent level’s height corresponds to the percentage of things that fall into that category. The funnel chart displays data values in a progressively decreasing or increasing fashion, as depicted below.
Uses of Funnel Charts
The stages of a sales process or the steps in marketing phases are frequently illustrated using funnel charts. The total number of potential consumers is represented at the pyramid’s base, while the number of actual customers is represented at the top. Businesses can more quickly identify potential customer-loss regions and take action to enhance their sales or marketing strategies by viewing data in this way. From the first interaction with a potential customer until the deal’s closing, there are several steps in the standard sales process. A funnel chart can monitor a salesperson’s progress through each stage of the process and determine which stage is most important. It frequently serves as a representation of sales opportunities as they move down the sales funnel. A funnel chart is valuable for visualizing data to identify potential bottlenecks or workflow gaps. The progression of a project through each stage, from initial planning to final implementation, can also be monitored using funnel charts.
Benefits of Funnel Chart
The primary benefit of using a funnel chart is to drill down the large or gross numbers to specific numbers to help organizations or stakeholders make better decisions. Some of its significant benefits include:
Recognizes the linear transition from a considerable number of potential clients to a smaller number of actual clients. Assists in visually identifying any process bottlenecks or friction points that might contribute to a decline in the number of prospects moving on to the next stage. Helpful in spotting trends or variations in the conversion rate that may need to be addressed. Tracks conversion rates at each stage of the process over time. Aids organizations visualize their sales funnel and monitor their progress toward their sales targets.
Next, we will discuss how to create a funnel chart in excel.
How to Create a Funnel Chart?
Let’s use a specific sales scenario to understand how a funnel chart is made. The funnel chart represents the progressive reduction of data as it passes from one phase to another, and the data in each phase is presented in different portions of the whole data. In a sales pipeline, there will be stages like: Prospects → Qualified Prospects → Proposals → Negotiations → Final Sales. Let’s create a sales funnel to demonstrate how the sales values decrease over time when deals are closed. A funnel chart below reveals the sales information in Columns B and C. The adjacent funnel chart is drawn by how the final sales figure was calculated from the total sales prospects. Let’s look at how to plot a funnel chart in Excel 2013. Please note: Excel 2013 does not have a direct option to enter create a funnel; however, Excel versions 2019 and later and Microsoft 365 subscriptions have. Step 1. Select the data range and go to Insert > Column, and select the 3-D 100% Stacked Column option as shown below: Step 2. Select Format Data Series by right-clicking on the column chart as displayed below. When the data series options display, choose the Full Pyramid Option, as shown below. Step 3: The pyramid option charts will be displayed as shown below: Step 4: Next, select the chart and go to Design > Switch Row/Column, as seen in the example below. The above step will process the chart and transform it into a pyramid chart, as shown below: Let’s see how to format it to better insight into the funnel chart. Step 5: As seen below, right-click the chart and choose 3D-Rotation. When the properties box appears, alter the X and Y Rotation values to 0 as shown below: Step 6: The funnel chart will look something like this after modifying the rotation values: Step 7: A funnel chart can be customized in several different ways. For instance, as shown below, you can right-click the chart and choose > Add Data Labels if you wish to label the data values on the funnel chart. If you want to apply this process to every segment of the funnel chart, you can repeat it. The example above thus shows how many sales prospects are discovered, but only some are verified, and even fewer qualify for proposals. Even fewer participants show up for the negotiations, and only a small number of agreements are ultimately reached.
Customizing Funnel Chart
Further, there are numerous options to alter how your funnel chart appears. Here are some crucial customization options to consider: You can alter the color of the funnel, enter specific color that fills a particular block, and other design elements using the top menu’s design settings, as seen below: Another crucial component of the funnel chart is the chart element, which can be used to emphasize numbers, names, etc., as illustrated below: Next, use the Chart styles option, shown below, to modify the color or style of the funnel chart. When you’re done customizing your chart, you can change the chart size to put it into a particular document. Choose the edge of the funnel chart box and drag it (inward or outward) to change its size. As previously mentioned, the procedures above relate to Excel 2013. In 2019 and later and with a Microsoft 365 subscription, there is a slightly more straightforward approach to inserting a funnel chart, as seen below: Go to the Insert tab, click the arrow next to the Waterfall button in the Charts section, and select Funnel, as shown below. The remaining formatting and stylistic choices are identical.
Final Words
The Microsoft Excel Funnel chart is a flexible tool used to visualize stages of the sales and marketing process and other forms of data, including emails (sent and opened), links, trial and subscription signups, and different types of data. Its numerous customization options would make it simple to meet the criteria for chart plotting and produce a user-friendly funnel chart. Next, you can check out how to create a drop-down list in excel.
![]()
![]()


![]()
![]()
![]()
![]()

![]()


![]()
![]()
![]()

