What is Debugging?
If you watch crime dramas, then the idea behind debugging will not be alien to you. Debugging is a process, and it involves a lot of tactics. It is the systematic finding and resolving problems and errors within a program.
Besides, debugging sorts out all the issues that can prevent the correct operation of software or, in this case, the web application. The process of debugging your API or web application primarily involves an attempt to reproduce the problem. Consequently, the need to send out an API request emerges. Now, this is where the problem lies. Most browsers will prevent you from changing the origin header, and even the limits on URL size. In other words, to reproduce the issue, you may need to perform some HTTP manipulations. And this will require some powerful debugging tools. All the components or tactics of the debugging process includes;
Interactive debugging Control flow analysis Unit testing Integration testing Logfile analysis Monitoring Memory Dumps Profiling
It is interesting to know that some HTTP clients, i.e., web browsers, have in-built web developer tools. These tools can be used to debug APIs. With this in mind, it is not necessary to write your debugging tool.
What is HTTP Client?
Suppose you think of building a system that leverages the HTTP protocol for distributed communication or HTTP-aware, such as a web application. Then you may want to look at the HTTP client component.
The HTTP, or HyperText Transfer Protocol, is the reason you can communicate or transfer data on the web, every time you type in a URL. It is an application protocol that makes browsing the internet possible. Now, the HTTP Client is a system that sends requests to a server in HTTP text format, and in turn, receives a response from the same server. It is essential to know the differences between an HTTP client and the HTTP server.
Differences Between HTTP Client and Server
While the HTTP client is often web browsers or utility, HTTP servers act as proxies to application servers. In simpler words, your smartphones, TVs, PlayStation, really any device that can connect to the internet, is probably using an HTTP Client. Similarly, the HTTP server is the network computer that the HTTP client connects to. The relationship they share is more of a conversational one. Where the HTTP client sends a request and the HTTP server responds.
Examples of HTTP Requests
Debugging the web has never been easier. With these tools, you can finally relax while you do what you enjoy.
HTTPie
The ultimate aim of HTTPie is to make CLI interaction with web services user interface friendly. This tool provides an HTTP command for sending requests, all with the use of a natural syntax.
HTTPie can be used for debugging, testing, and connecting with HTTP servers. It supports HTTP, HTTPS, and proxies. Highlights
Built-in JSON support system Can be installed on Windows, macOS, and Linux Custom HTTP headers and method Submit forms Offline mode Basic and digest authentication Intuitive syntax
Don’t want to install HTTPie locally? No worries, now you can run it online.
Fiddler
Fiddler is a cross-platform web debugging proxy. It can help manipulate web sessions, inspect HTTPS traffic, and monitor traffic between your computer and the Internet.
You can install Fiddler on Windows, macOS, and Linux. It is probably the most popular tool to debug traffic.
RESTer
RESTer is available as an extension for Google Chrome and Firefox.
Highlights
Authorization headers with Basic or Auth2 authentication View request history Perform requests with any method, URL, body, and custom headers Testing and debugging APIs
Paw
Paw is a full-featured HTTP client, which allows you to send all kinds of HTTP requests. With Paw, you can test your APIs and also explore new ones.
Paw is exclusively built for macOS, and it has features that are easy to use. You can import and generate swagger, RAML, etc. and it supports JSON schema. Highlights
Supports multiple authentications like basic, OAuth, hawk, digest Dynamic values Environments Extend through java-script based extensions Cookies and session manipulation
Requester
Requester is a robust client that combines the features of HTTPie, Postman, and Paw. It works only with Sublime Text editor.
Highlights
Supports JSON Schemer Request collections and history Colorized output with syntax highlighting Modern UX Cookies, custom headers, request body, and query parameters are easy to set. GraphQL support
Postman
Always working on APIs? You’ll fall in love with Postman. Postman is unarguably one of the more popular HTTP clients used for debugging web applications. It allows for faster and easier API development.
Highlights
Packs a powerful GUI, with a user-friendly interface History of requests Automated testing with collection runner Flexible API monitoring Support REST, GraphQL, SOAP Multiple payloads support including JSON and HTML
cURL
cURL is a command-line tool that is used for sending data using URL syntax.
The good thing, cURL is by default installed on most of the UNIX-flavored operating systems. It supports many protocols, including FTP, LDAP, POP3, SMTP, GOPHER, IMAP, HTTP, HTTPS, and SCP.
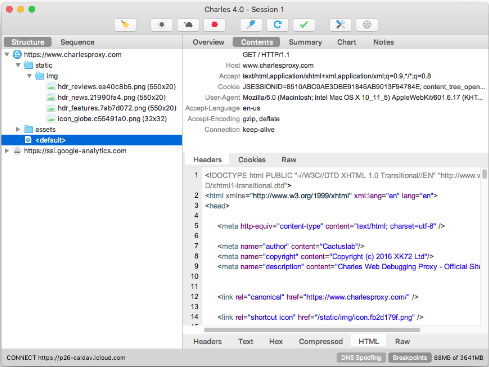
Charles Proxy
As the name says, Charles proxy is an HTTP and reverse proxy. It works by routing local traffic through it.
You can use Charles for SSL proxying, bandwidth throttling, AJAX debugging, breakpoints, and more.
Whistle
Whistle is a NodeJS-based cross-platform debugging tool to capture and manipulate HTTP, HTTPS, WebSocket, and TCP traffic.
First, you need to install NodeJS and then Whistle using npm. You can always extend the features with the plugin if default features don’t suit your requirements.
mitmproxy
mitmproxy is a popular open-source HTTPS proxy among security researchers. Use it as a CLI, web, or Python API.
The web interface gives you the look and feel of Chrome developer tools. It supports HTTP/2 as well.
Proxyman
Similar to the above-mentioned Paw, Proxyman is a premium native macOS web debugging proxy application.
It acts as a man-in-the-middle for web traffic and offers many features, including the following.
SSL proxy Repeat requests Protobuf ReWrite scripting Local and remote map Content filtering Syntax highlighting
Proxyman UI is very human friendly.
HTTP Toolkit
HTTP Toolkit is an open-source HTTP debugger. It’s a desktop app available for Windows, Mac & Linux. Unlike other HTTP debuggers, HTTP Toolkit provides automatically targeted interception for specific clients, including HTTPS setup, rather than intercepting everything from your entire computer, and so avoids capturing irrelevant traffic or disrupting other applications.
With one click you can intercept browser windows (including Chrome, Firefox, and more), backend/scripting languages like Node.js, Python, and PHP, any command-line tools, Electron apps, or Android devices & emulators (including system-level HTTPS interception). HTTP Toolkit supports standard HTTP debugger features including breakpoints & rewriting HTTP(S) traffic, filtering and searching collected traffic, and highlighting & autoformatting for many popular request & response body formats. Core features to intercept, inspect & rewrite HTTP(S) are all available for free, while some advanced premium features like import/export and automated mock rules require a paid account.
Conclusion
The above HTTP clients and web debugging proxy can help you in many ways. Most of them are free or offer a trial so try some of them to see what works for you. Happy troubleshooting!
![]()


![]()


![]()
![]()
![]()
![]()

![]()


![]()
![]()
![]()

