There are plenty of sophisticated tools to monitor traditional application performance, but serverless is still picking up. Serverless architecture is different, so you need a tool that is made for that. These tools tightly integrate with the serverless runtime platform to collect essential data for better visibility and debugging. They help you to develop your application faster and confidently. If you are new to Serverless, then you may consider checking this introduction article or consider taking an online course. Ready to explore?
Dev Tools
SLS-dev-tools (also known as Serverless Development Tools) is an open-source project which consists of developer tools for serverless applications and platforms. It is developed by a London based software company – Theodo. Their cloud-native approach with Serverless provides greater ability and speed for innovation. The navigation in this tool is done through arrows keys and tab is used to switch to different panes. Select any lambda function and press enter to get a view of the detailed statistics of the function. They follow the pay-per-use model, so you don’t need to pay anything for the time your application is not running. This tool has an advanced version of it called at SLS-dev-tools Guardian. This tool is used for automating the best audit practices in serverless architectures. It helps in identifying issues at a very early stage so that they can be stopped from occurring.
SenseDeep
SenseDeep is one of the fastest serverless monitoring platforms for AWS. It can help you to troubleshoot the services in real-time. Once you log in, SenseDeep will automatically create a few log reports which you can launch to see the details. You need to connect the SenseDeep cloud with the AWS account to view the serverless functions and logs. You can use AWS access keys or IAM roles option to connect with AWS. Once the connection is successful, the auto-discovery functionality of SenseDeep will find the lambda functions and log groups to be displayed on the home screen. The SenseDeep dashboard shown above is very customizable. You can choose which widget to show and even resize the widget in the dashboard. This dashboard can be shared with the team members also. Below are the other features offered by SenseDeep:
Creates and displays lambda function metricsProvides details view of each lambda functionProvides log viewer window with search, query scroll functionalitiesNavigation page with common commands at your fingertip
Lumigo
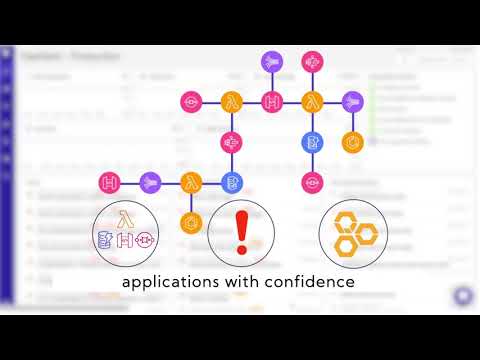
Instantly monitor and troubleshoot your serverless applications with Lumigo. With this platform, you can trace the application journey from beginning to end. It uses real-time monitoring and analysis to understand complex system behaviors and help you to resolve issues faster. You just need to create an account, connect your environment, and set up the alerts. It identifies the root cause of the problem and solves it in your distributed environment. It has functionalities to detect critical path and choke points of the application, which helps to optimize performance by increasing efficiency and reducing latency. It helps you in serverless configurations and development activities by guiding you with the best practices. With such help, you can identify the misconfigurations and issues before it goes on the production environment. Lumigo provides easy to understand application cost structure which helps you plan and forecast your upcoming expenses.
Serverless Framework
Serverless Framework is a tool that helps you develop, deploy, and monitor your serverless applications with minimum overhead and cost. With Serverless Framework Pro, you don’t need to spend time coding in order to monitor your application. It is all taken care of! Just go to the dashboard to look at the performance of the application, error details, request patterns, etc. You can deep dive into the logs to get more detailed information on the application. The alerts provided is absolute to the point with the necessary details required for you to resolve the issue. The collaboration feature on this platform is just simply amazing! You can share the dashboard with team members so that they can also collaborate with limited access.
Dashbird
Dashbird is a popular solution for the AWS lambda based application. It connects to AWS and provides account, service, and function level metrics to optimize cost, performance, and resources. Dashbird can detect lambda specific failures. Ex:
TimeoutMemory issueMisconfigurationRuntime errorsExceptions
Failure alerting can be notified through email or slack. Cloudwatch logs are available in full-text searches, and you can do a live-tail for troubleshooting. Features:
Errors from various metrics for easy troubleshootingAccount-wide system health and real-time metricsCreate monitoring for a function which is essential for your business – Microservice monitoringSystem performance metricsExecution timeline and invocation breakdown
Dashbird integrates with AWS X-Ray to give you invocation insight. You can get it started for FREE. Currently, it supports the following languages.
JavaNode.jsGoPython
Give a try to see how Dashbird works. They got great documentation.
IOpipe
Alerting, real-time metrics, error aggregation, profiling, tracing – everything is available in IOpipe. Get the complete picture of what your AWS lambda functions are doing and be notified on slack, email, webhooks, and PagerDuty when something goes wrong. Metrics are shown in high-resolution, and you can drill-down to the exact invocation. IOpipie got powerful tracing to track the function call and alert when performance degrades. This can be handy to troubleshoot performance-related issues after the release. Let’s take a look at some of the features.
Powerful search to trace data, faster.Weekly email reports about top errors, alerts, performance improvements, etc.Invocation taggingTroubleshoot Node.js for high CPU utilization with CPU profiling
IOpipe is DevOps for the serverless application. You can try their FREE plan to monitor 1 million function invocation every month.
Splunk
Splunk is capable of monitoring AWS Lambda, Google Cloud Functions, and Azure Functions. Real-Time visibility and performance monitoring for your functions. Some of the features are:
Low latency metricsReal-time visibility and aggregationMemory usage and execution time monitoringCold start detectionCost optimization
Thundra
Take a look at Thundra interactive demo. Thundra helps you to track and profile your AWS Lambda-based application with zero overhead. As you can see in a demo, the following metrics are beautifully presented in graphs.
Invocation count and durationCold start count and durationError by functions and types
Thundra doesn’t overhead your functions as it leverages CloudWatch logs asynchronously to observe your serverless application. Some of the features are:
Dynamic instrumentation so you need to add the environment variable instead of code change and redeployment.Detailed and configurable tracingData filtration and advanced searchAdvanced debuggingProfile your Lambda functions to see CPU and memory utilization along with GC counts
Thundra is still in beta, and you can try it today. By default, CloudWatch collects basic Lambda metrics. However, you have an option to enable the custom metrics. There is no upfront fee or commitment, so you can get it started for FREE and pay as you use/go. With the help of CloudWatch, you can collect all your AWS data from a single platform to have complete visibility of resources.
Epsagon
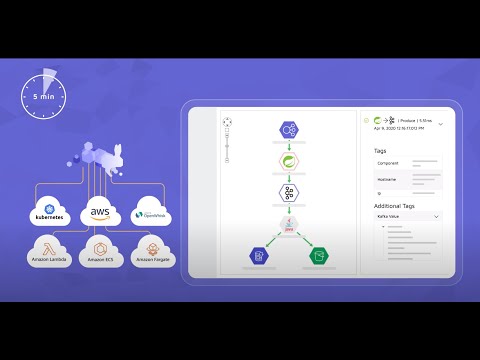
Epsagon leverages distributed tracing technology with AI algorithms, to automatically detect full transactions throughout a company’s system, provide performance and costs of the business process, and notify the users of issues before they occur. Epsagon uses automatic instrumentation and requires no code changes from the user. Conclusion I hope this gives you an idea about some tools to help you monitor and debug your modern application. Most of them got a FREE plan, so the best thing to do is to give a try to see what works for you. After implementing monitoring, don’t forget to secure it.

![]()


